
Since the discovery of COVID-19, we have all looked to various regional and global data and reports to provide us with an indicator of how we are managing the pandemic. In the beginning, the World Health Organization and both regional and global news organizations provided simple charts showing the total cumulative number of cases and deaths by area, but this early failed to provide the valuable insight needed to truly understand and manage the pandemic going forward. For example, new cases and new deaths didn’t allow us to project how many hospital beds and ventilators would be needed, so reporting on this data began. With this data came more questions – how do hospitalizations this year compare to those from last year? How many are actually COVID-19 related? What is the capacity for my area, and have we reached it? Over time, reporting on COVID-19 has improved drastically to include trends, comparables, drilldowns and many other key factors that have and continue to help us understand and better manage this pandemic, but it took time to figure out what we needed to see, how we needed to see it and why.
Similarly, in the business world, the data we see and how it is presented to us is key to understanding our situation and making decisions that lead us to the best possible results for our business. Today, we are going to use some of the COVID-19 reporting lessons learned (using Manitoba, Canada’s data) to highlight five critical “do’s and don’ts” of reporting.
When giving access to reporting and sending out regular updates, targets and expectations need to be crystal clear, otherwise you leave this open to interpretation. Which then leads to a significant amount of time and energy wasted by the reader trying to determine what is good and what is bad. Not only can this result in your readers (your team) being misaligned, but it can also result in unnecessary pessimism or discouragement. Doing this properly is one of the most important areas of reporting. Creating and justifying appropriate targets is not always easy and it is critically important to consider things like seasonality, day of the week/month of the year, direct and indirect factors such as the general economic climate, data availability, etc. But spending time here to have these thoughtfully and accurately calculated and communicated is critical to proper interpretation and subsequent engagement and actions taken.
Let’s work through this with the typical daily COVID-19 case headline – for simplicity, let’s say after our analysis we decide on setting the Daily Target to be below 80 Cases/Day.
Current Headline: 62 New Cases Today
Is that good or bad? How does that compare to our expectations?
New Headline with Expectations: 62 New Cases Today - 18 Below Target
Referencing the target in addition to stating the number of new cases makes it very clear that 62 New Cases is positive news.
Once you’ve set and communicated targets and expectations, next you want to provide incentives for performance. This can be a very powerful tool in helping to improve performance, morale, and teamwork. If incentives are not provided in correlation with performance this can quite rapidly lead to disengagement and demotivation.
Using the sample above, let’s say we use the same sample target of 80 new cases/day for the entire month of March, which would represent 2,480 total cases for the month – this target would then be announced and made clear. If we are told that we are able to lift our next scheduled set of restrictions provided we meet that clear target, we are now more likely to work to meet that target, as we have a clear incentive to do so. Taking it further – what happens if we work REALLY hard and knock it out of the park? This is where having a “Projected % of Target” metric with incentives based on higher levels of achievement can really drive performance – in this case (lower percentages are better) it might be 60% or 80% of our threshold.
Below would be our snapshot of monitoring COVID-19 Cases for the month vs. our Target:
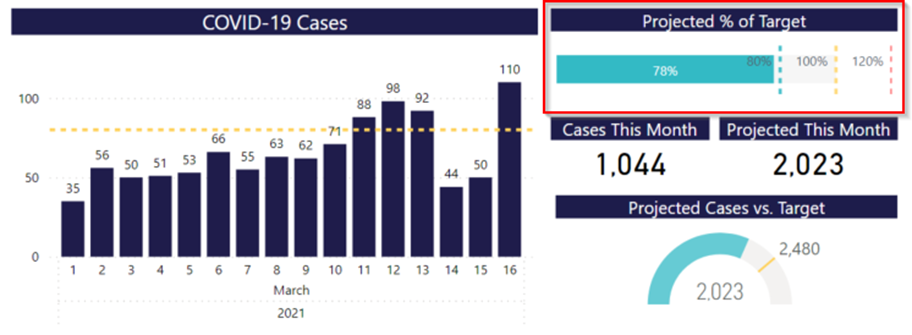
This helps to change the focus and energy on the short-term volatility of a day case count to an aligned target for the month. And the “Projected % of Target” is a simple and relatable metric to keep people engaged as it can still fluctuate on a daily basis.
*Now given the complexity of COVID-19, there would need to be multiple metrics and thresholds involved to be able to create incentives (such as keeping Hospitalizations and Deaths).
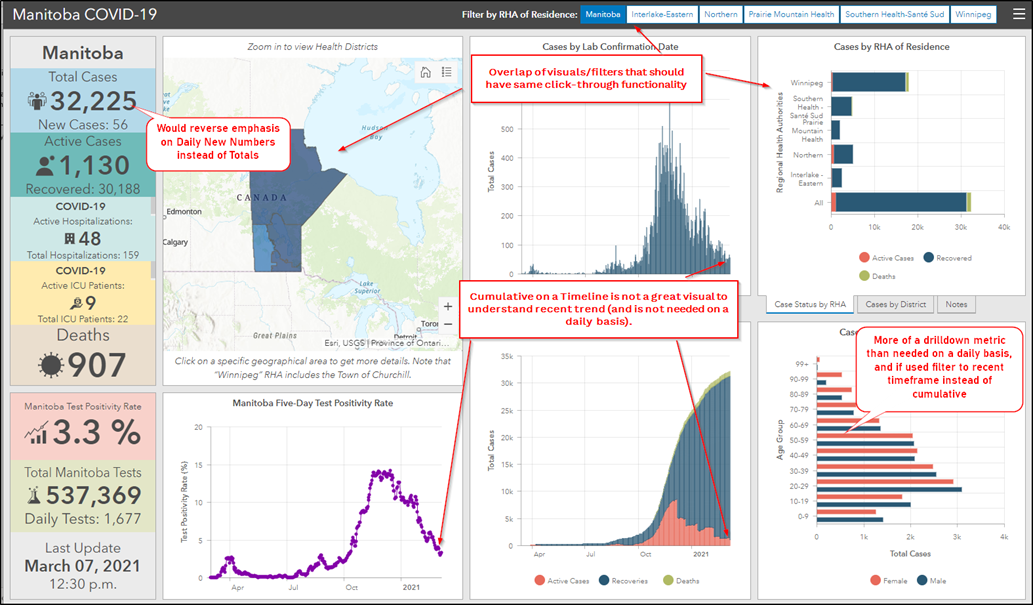
Daily reporting on Daily Cases, Daily Deaths, Tests Complete, Positivity Rate, 5-Day Positivity Rate, 7-Day Rolling Avg. Cases, Hospitalizations Contagious, Hospitalizations Non-Contagious, ICU Contagious, ICU Non-Contagious, Total Cases, Total Active Cases, and Total Deaths…is overwhelming. There is no doubt that all of these numbers can have an impact but part of managing reporting properly is narrowing down to your most important metrics to present. And again, similar to not setting Targets would leave these metrics open to interpretation by the reader to determine which metrics are the most important.
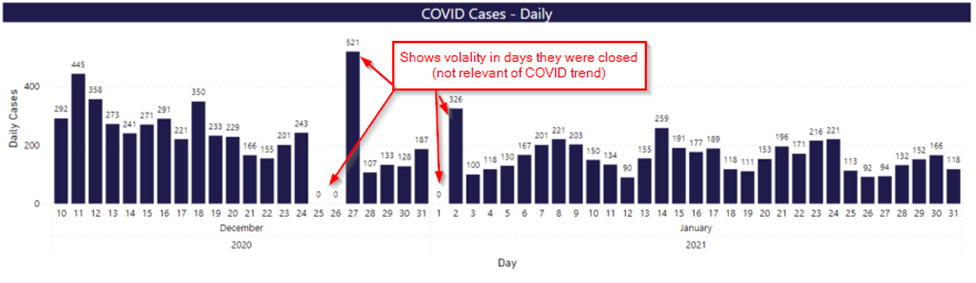
Let’s try to eliminate some by looking at Case Numbers and Correlated Factors – the volatility of a single daily number can be dramatically skewed by several factors which are not telling of the overall trend (day of week, holiday, test counts, processing back-ups etc.). A rolling average will smooth these single day spikes into a number we can use to more accurately gauge how we are doing.
After our analysis lets say we determine a 3-Day rolling average has the best balance of considering these factors while still shows the recent trend.
Current Visual Used (Based on Daily Case Count Numbers)
Three Day Rolling Average Headline & Visual (Considering Volatility & Expectations)
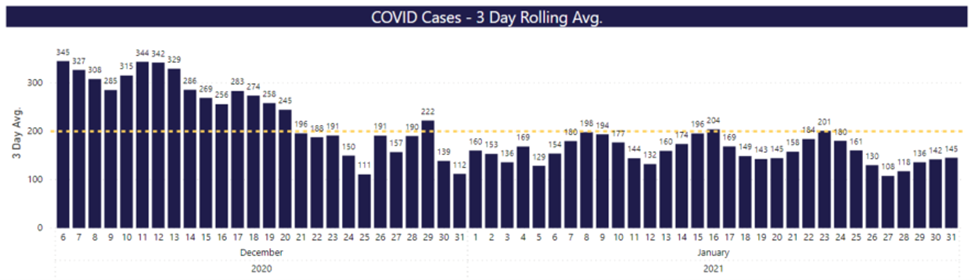
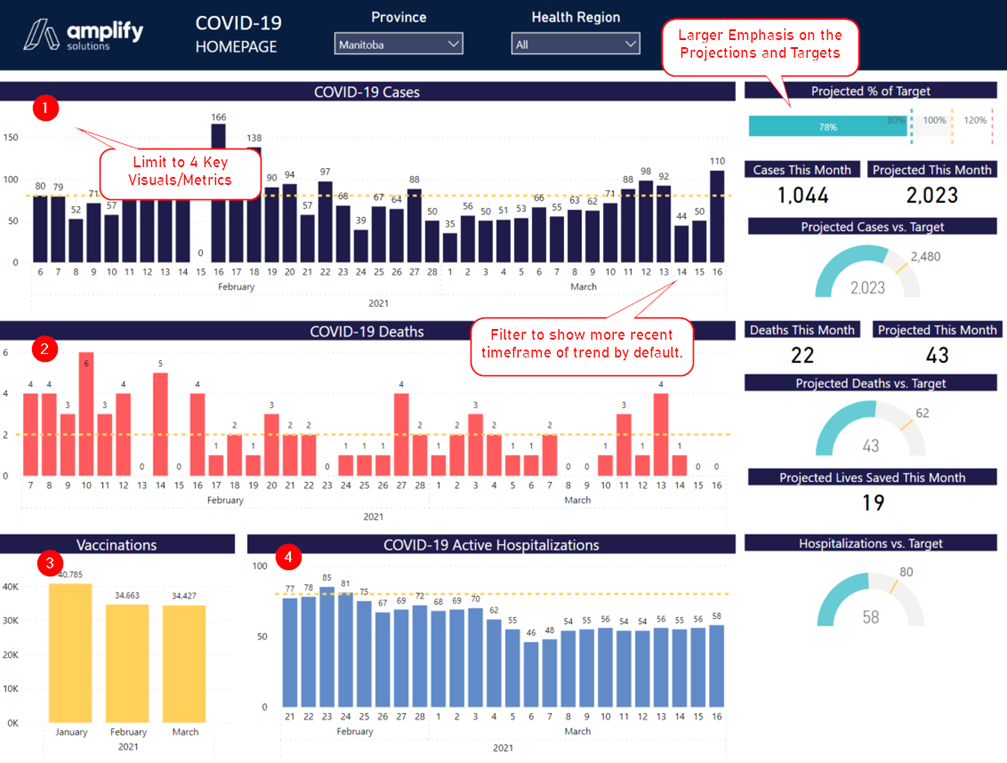
Not only do we have a more accurate picture of the trend, opposed to looking at volatile daily case counts, we can now commit to this metric and remove; tests completed, daily cases, 7-day rolling average, etc. from our main report (can still use this for analysis but not necessary to be overwhelmed with too many options on a daily basis).
Once you have a dashboard that includes your top key metrics, you need the ability to investigate the trends you see. For example, what is causing a higher rolling average? This is where setting up the right drilldown path becomes critical.
Let’s use COVID-19 age grouping as an example. As we know, COVID-19 reporting is broken down into age “buckets” (cases by age range) – 0-10, 10-19, 20-29 etc. The problem with these buckets, is that school aged children are grouped with both babies and university students, which doesn’t allow us to drilldown very effectively to determine what behaviours are causing trends - grouping by 10’s may be easy, but it’s not effective in helping us analyze the data. Are cases being contracted in schools? Are university students more likely than high school students to contract COVID-19? There needs to be sound reasoning that buckets/categories are chosen so that if there are trends by bucket or category, we can drill down to understand the behaivour.
In this example, buckets with similar contact groups would be far more effective (0-4, 5-12, 13-18, 19-25, 26-35, 36-50, 50-65, 66-80, 80+) as the goal is to use groupings that would help to tell the story of where the cases are coming from. If there is an increase in cases in the 19–25 year-old bucket, are they contracting cases from restaurants or university classes? Does moving University classes from in-person classes to remote learning impact this trend? Does a 10:00 p.m. last call at restaurants impact this trend? Was the impact higher or lower than expected?
These are the types of questions (and answers) we want to get out of our drilldown visuals (otherwise this just leads to more noise in our reporting).
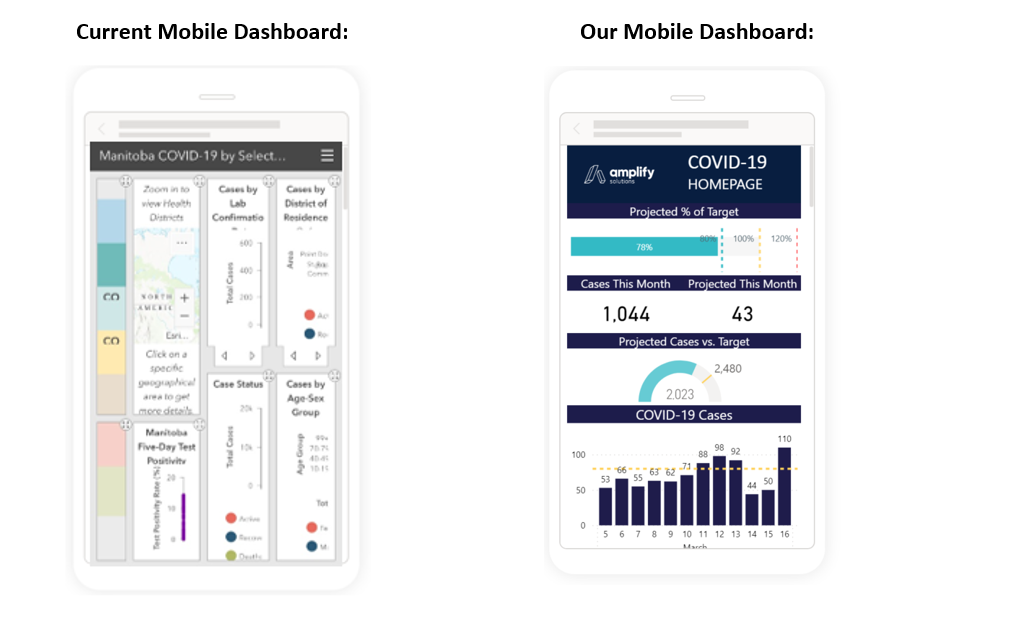
Finally – be mobile friendly. With mobile traffic up 222% over the last 7 years, ensuring your reporting is mobile friendly should go without saying. Odds are, especially when you are reporting daily, users are primarily logging in from their mobile device and ensuring your reporting is mobile friendly will improve both user experience and engagement.